一、前言
在正式讲解之前,我们先把上一节缺省的地方补齐。
1.1 枚举类实现
IMetricsEnum 和 IMetricsTagEnum 均为接口定义,下面我直接给出它们的实现类。具体的每个指标含义下面会详细讲解。
1 |
|
1 |
|
1.2 一键注册指标
对于交给 IMetricsTagEnum 类管理的指标,在 BaseMetricsUtil 类中提供了一键注册的方法,我们仅需要在程序启动成功后调用下即可。为了方便起见,我就直接写在启动类中了。
1 |
|
特别需要注意的是,启动类增加了 @EnableScheduling 注解,这是因为本节模拟的指标数据都是用定时任务产生的。
二、Metrics 埋点
2.1 Counter
先来介绍下最简单的 Counter 类型,它是不断递增的一种数据结构,你可以将其理解为计数器。
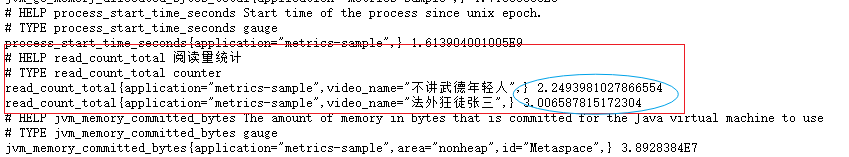
假设我们想要统计两部视频的阅读量:
(1)在 MetricsEnum 中定义阅读量的指标:
1 | READ_COUNT("read_count", Type.COUNTER, "阅读量统计") |
nameMetrics 指标的名字type自定义的 Metrics 的类型,用于初始化的时候去 Prometheus 注册哪种 MetricsdescriptionMetrics 指标的描述
(2)在 MetricsTagEnum 中定义具体的指标实现,如下所以,我们定义了两个 video_name 不同的阅读量指标:
1 | READ_COUNT_1(MetricsEnum.READ_COUNT, new String[]{"video_name", "法外狂徒张三"}), |
metricsEnum指定所属的 MetricsEnumtags该 Metrics 对应的 label(在不同系统中叫法不一样,在 java 中就是叫 tag),必须成对出现,其实就是一组组键值对。
下面来写一个定时任务,去模拟阅读量的递增:
1 |
|
尝试启动程序,访问 http://127.0.0.1:7002/prometheus ,你应该能够看到这两个 metrics 已经出现在其中了,并且随着每次刷新,其数值都会自增。
2.2 Gauge
让我们关闭程序,继续学习 Gauge 吧。Gauge 官方名称叫做测量仪,Prometheus 每隔一段时间(称为采集间隔)就会访问一次 Metrics 端口,访问的这一刻这个值是多少就是多少。
因此使用 Gauge 的指标的数值可增可减,没有先后关系。方便用于统计系统的实时信息,例如访客数、每分钟阅读量等等。
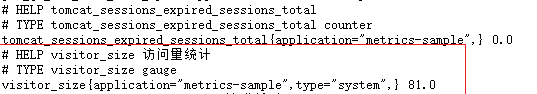
假设我们想要统计系统此时的访客数:
(1)在 MetricsEnum 中定义访问量的指标:
1 | VISITOR_SIZE("visitor_size", Type.GAUGE, "访问量统计") |
(2)在 MetricsTagEnum 中定义具体的指标实现,如系统访问量:
1 | SYSTEM_VISITOR_SIZE(MetricsEnum.VISITOR_SIZE, new String[]{"type", "system"}) |
咱们来写一个定时任务,去模拟实时的访客数:
1 |
|
运行程序后,一样能够找到这个指标。
2.3 Timer
Timer 类型的指标,适合用于统计一些耗时,也能够方便的进行百分位统计。
这里初学者包括我刚刚用的时候,就会习惯用 Gauge 去做耗时统计而不是用 Timer 类型。Gauge 类型的特点是测量仪,Promethues 默认的采集时间是 60s,那么使用 Gauge 统计耗时其实就是统计每隔 15s 你的耗时。这其实就是一个非常粗粒度的采集,60s 间隔内的耗时 Prometheus 都没采集到。
而 Timer 不一样,它有一个显著特点是客户端计算。Prometheus 你不是 60s 采集我一次嘛,没关系,我在客户端内记录下你调用 Timer 的次数(count)、总和(sum)、最大值(max)。这样 Prometheus 采集到的就不同于 Gauge 的粗粒度的、单独的一个数据,而是一个最小粒度的数据。
解释完 Timer 和 Gauge 的区别后,开始我们的例子吧。
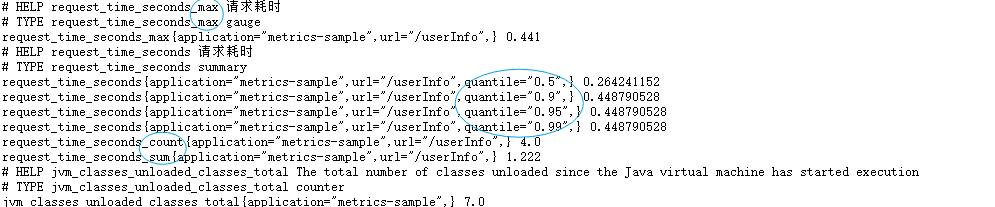
假设我们想要统计系统某接口的响应时间:
(1)在 MetricsEnum 中定义请求耗时的指标:
1 | REQUEST_TIME("request_time",Type.TIMER, "请求耗时") |
(2)在 MetricsTagEnum 中定义具体的指标实现,如 userInfo 这个接口的请求耗时:
1 | USERINFO_REQUEST_TIME(MetricsEnum.REQUEST_TIME, new String[]{"url", "/userInfo"}) |
咱们来写一个定时任务,去模拟这个接口的响应时间变化:
1 |
|
四、连接 Prometheus
我们需要编辑 prometheus 配置文件,我试了下 Docker 的 Promethues 配置变更不支持热部署,所以需要先通过 Docker Dashboard 将 Prometheus 容器关闭。
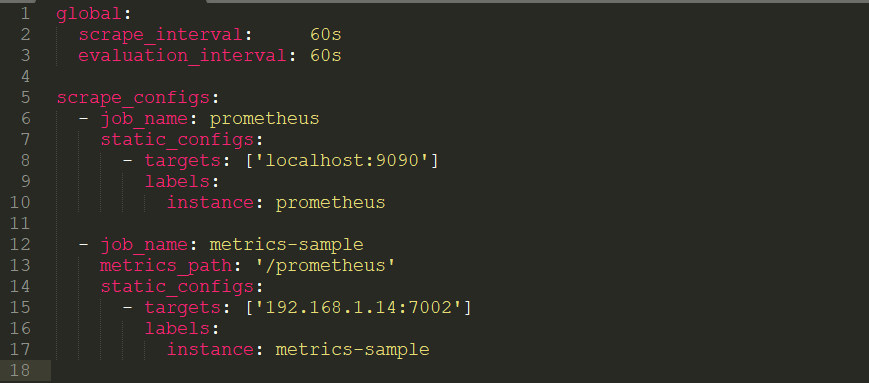
然后编辑 prometheus.yml 文件,增加一个节点:
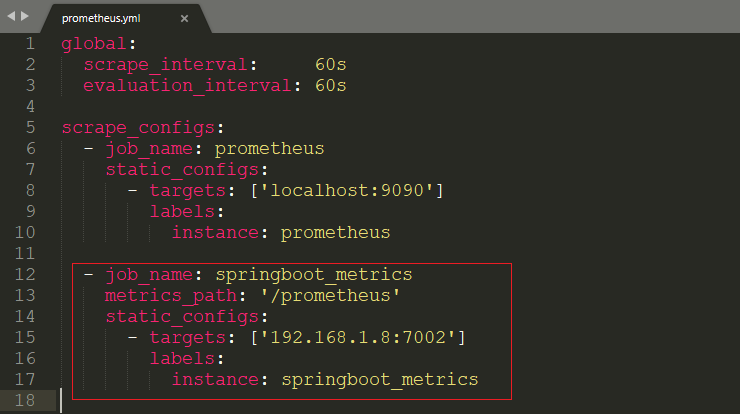
这里多了一个 metrics_path,是因为 prometheus 默认采集的 /metrics 路径,而我们是用的 /prometheus 路径,所以要显式声明一下。或者修改程序的配置文件,加入如下两行也是一样的效果:
【注:这里有个坑,因为我的 Prometheus 和 Grafana 都是用容器启动的,所以它们之间用 localhost 是可以连接的。但是我的 SpringBoot 应用跑在容器外,Prometheus 连接 SpringBoot 应用就必须用我物理机的 IP,不能用 localhost】
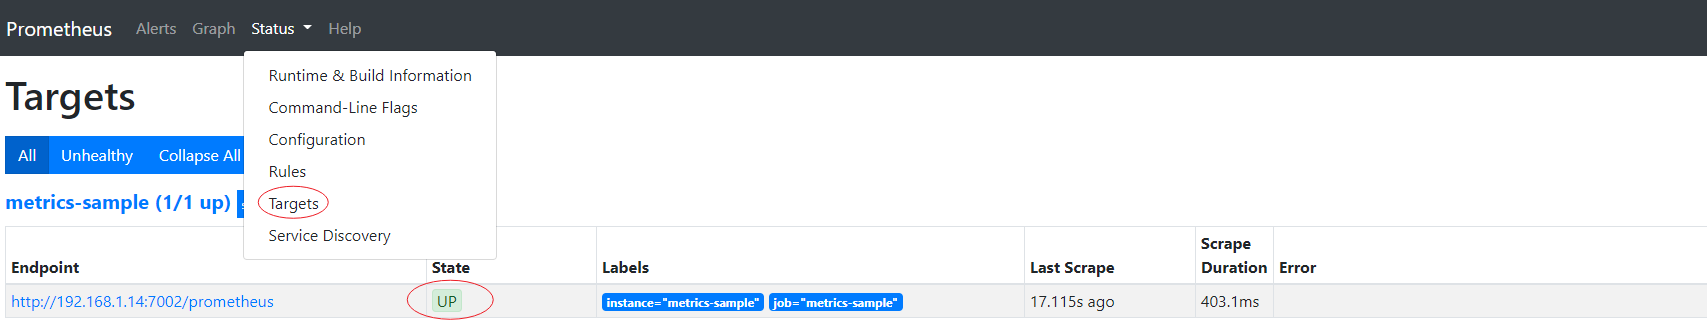
将 Prometheus 重新启动后,进入 Status -> Targets 等我们的服务变成 UP 就连接完毕了。
五、Grafana
下面我们尝试在 Grafana 中将我们的指标渲染出来。
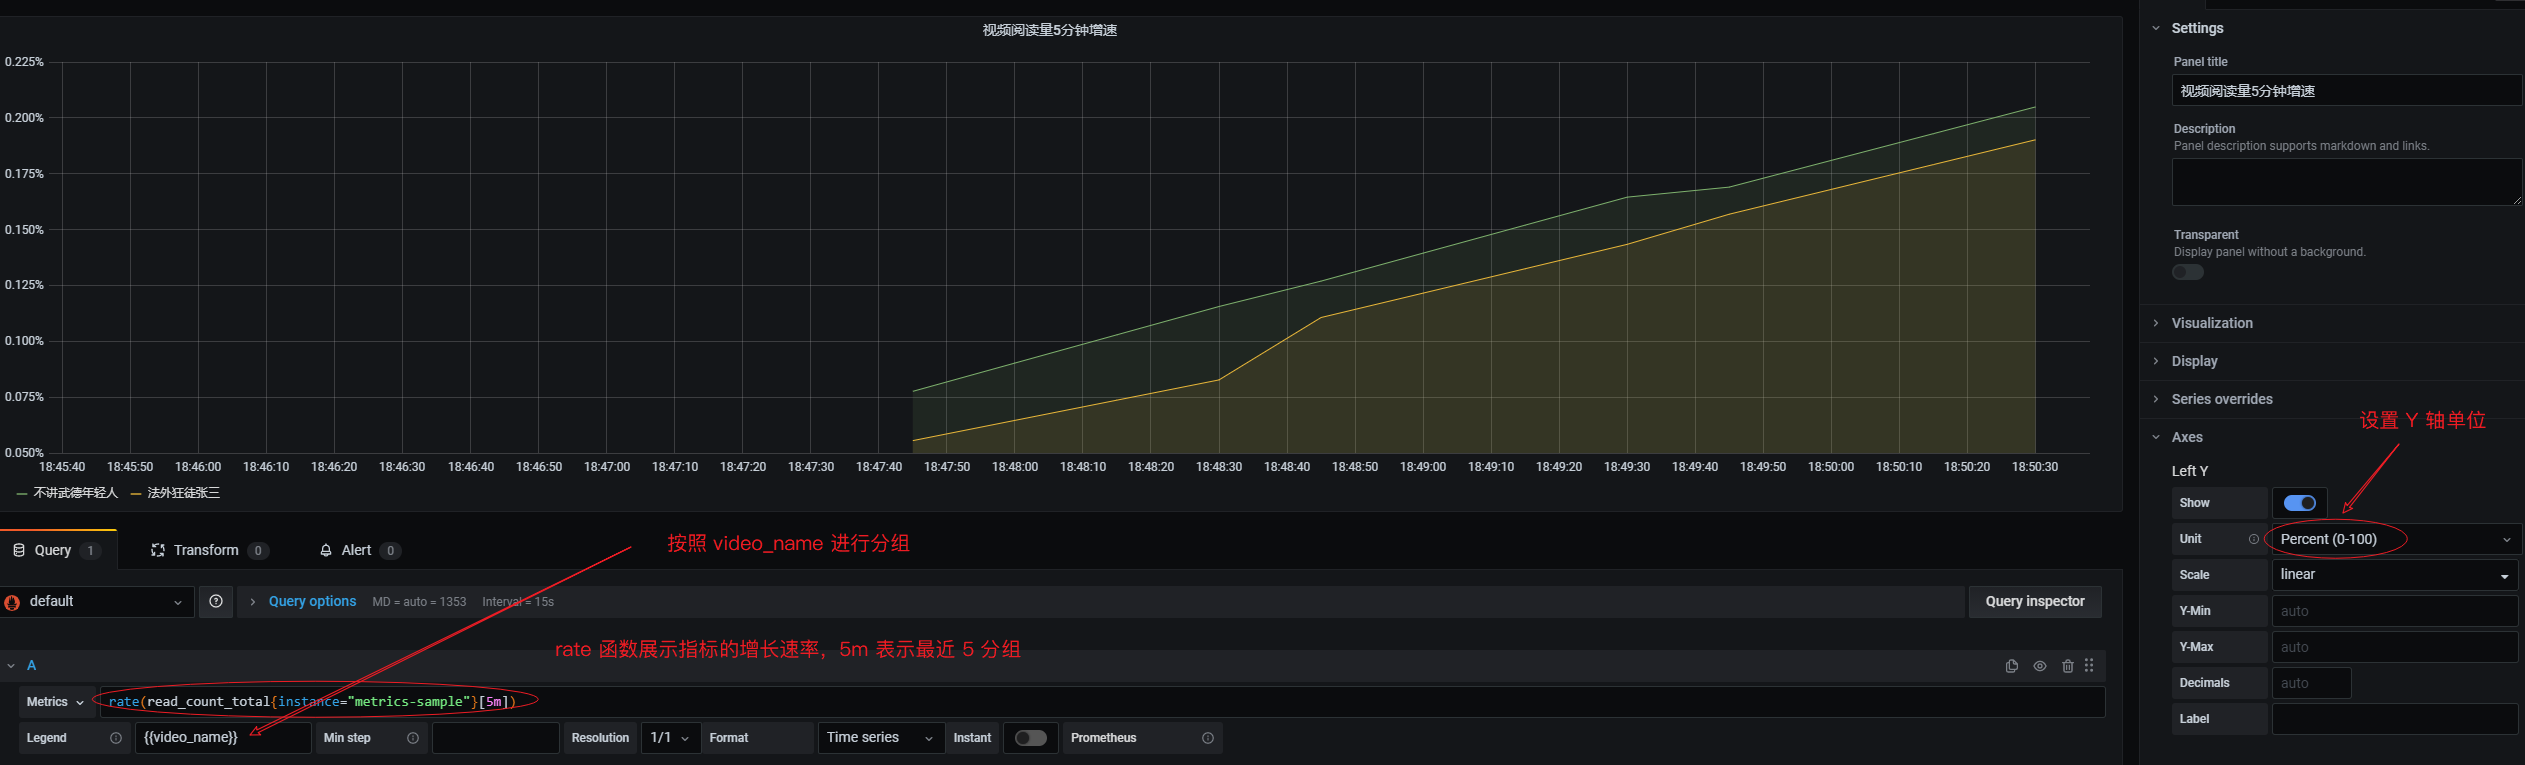
5.1 Counter
这张图表将展示视频阅读量在 5 分钟内的增速:
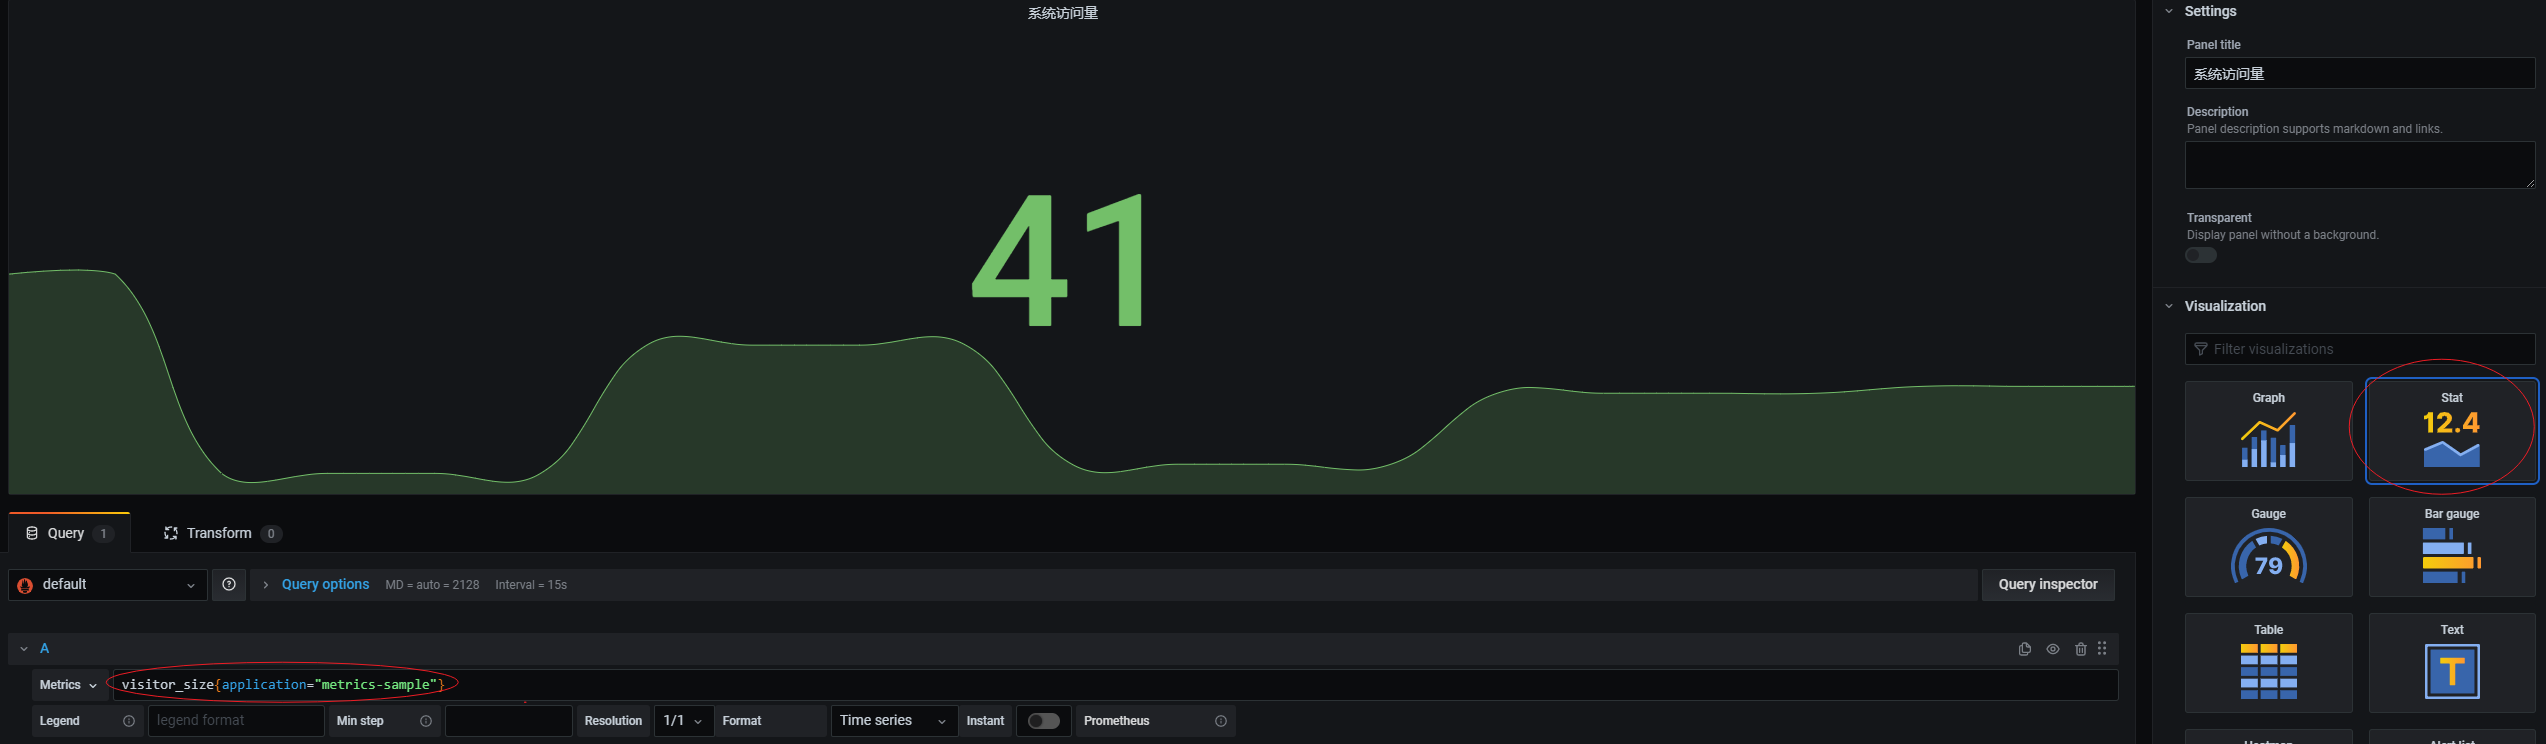
5.2 Gauge
这张图表将展示系统当前的访客数信息:
5.3 Timer
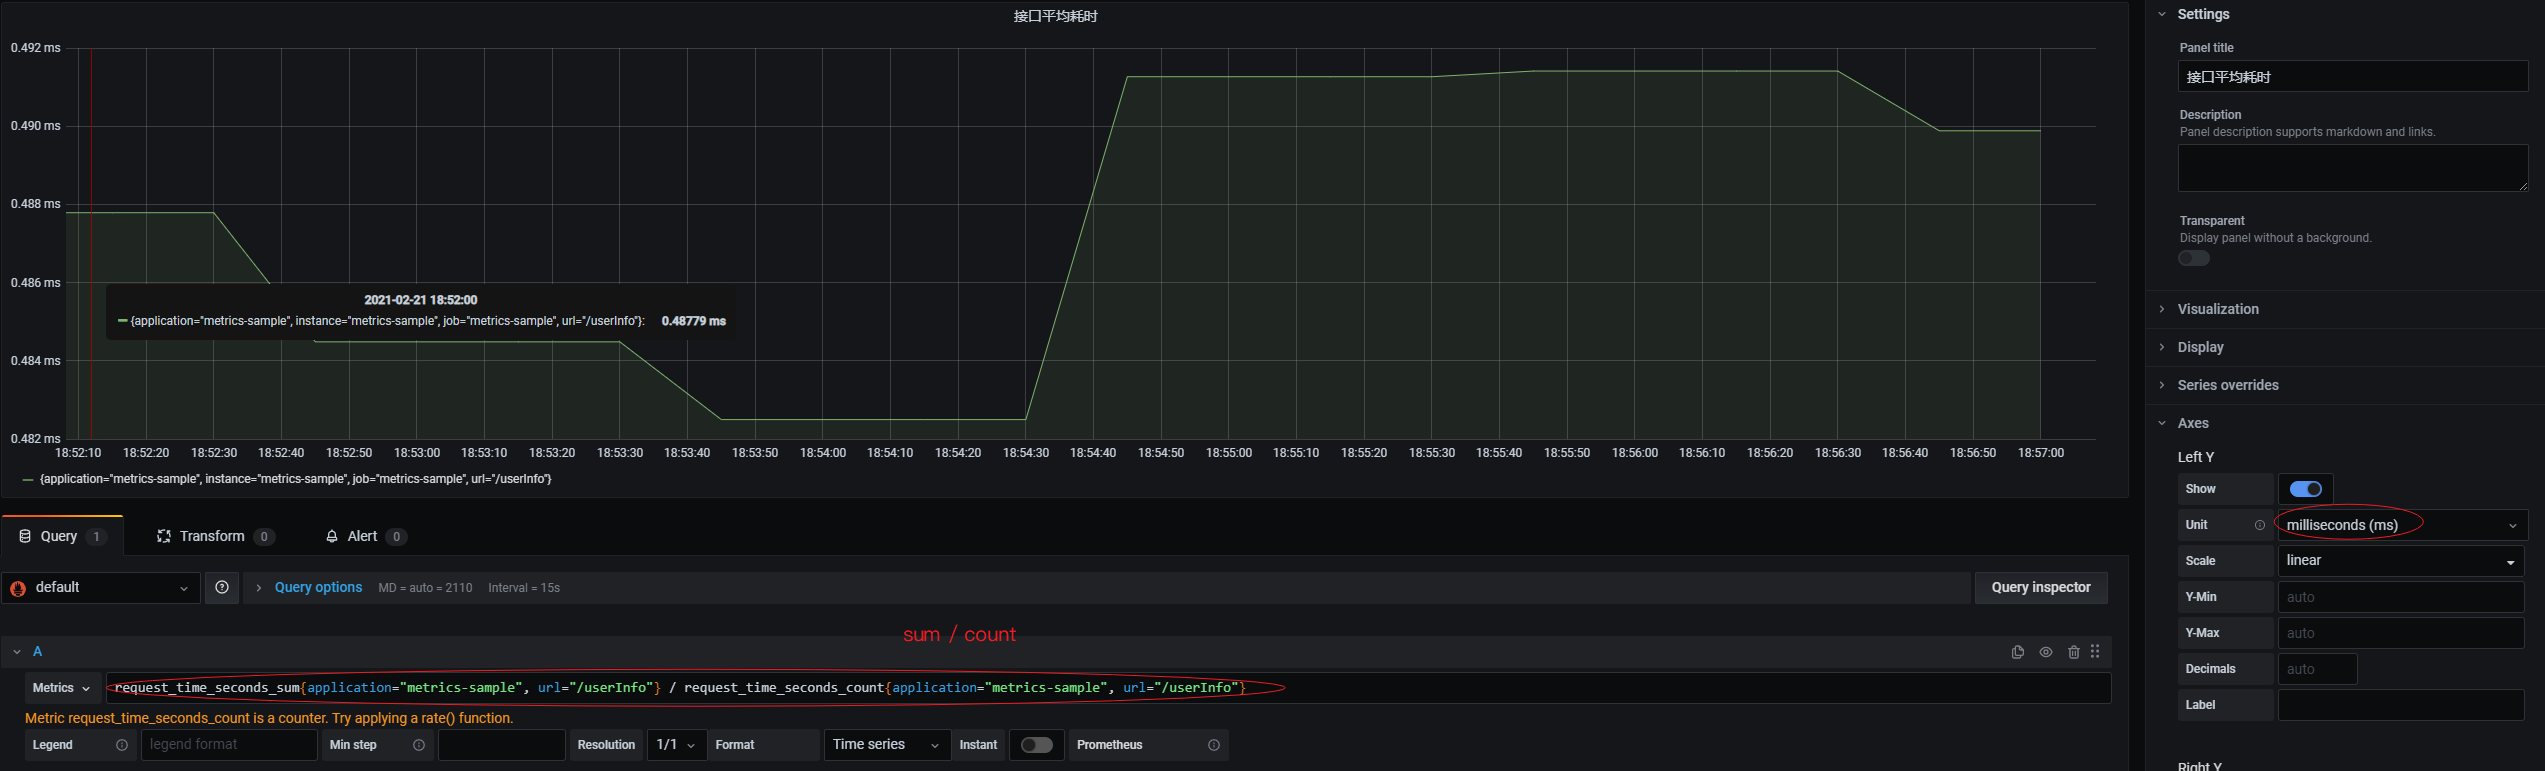
这张图表将展示接口的平均耗时信息:
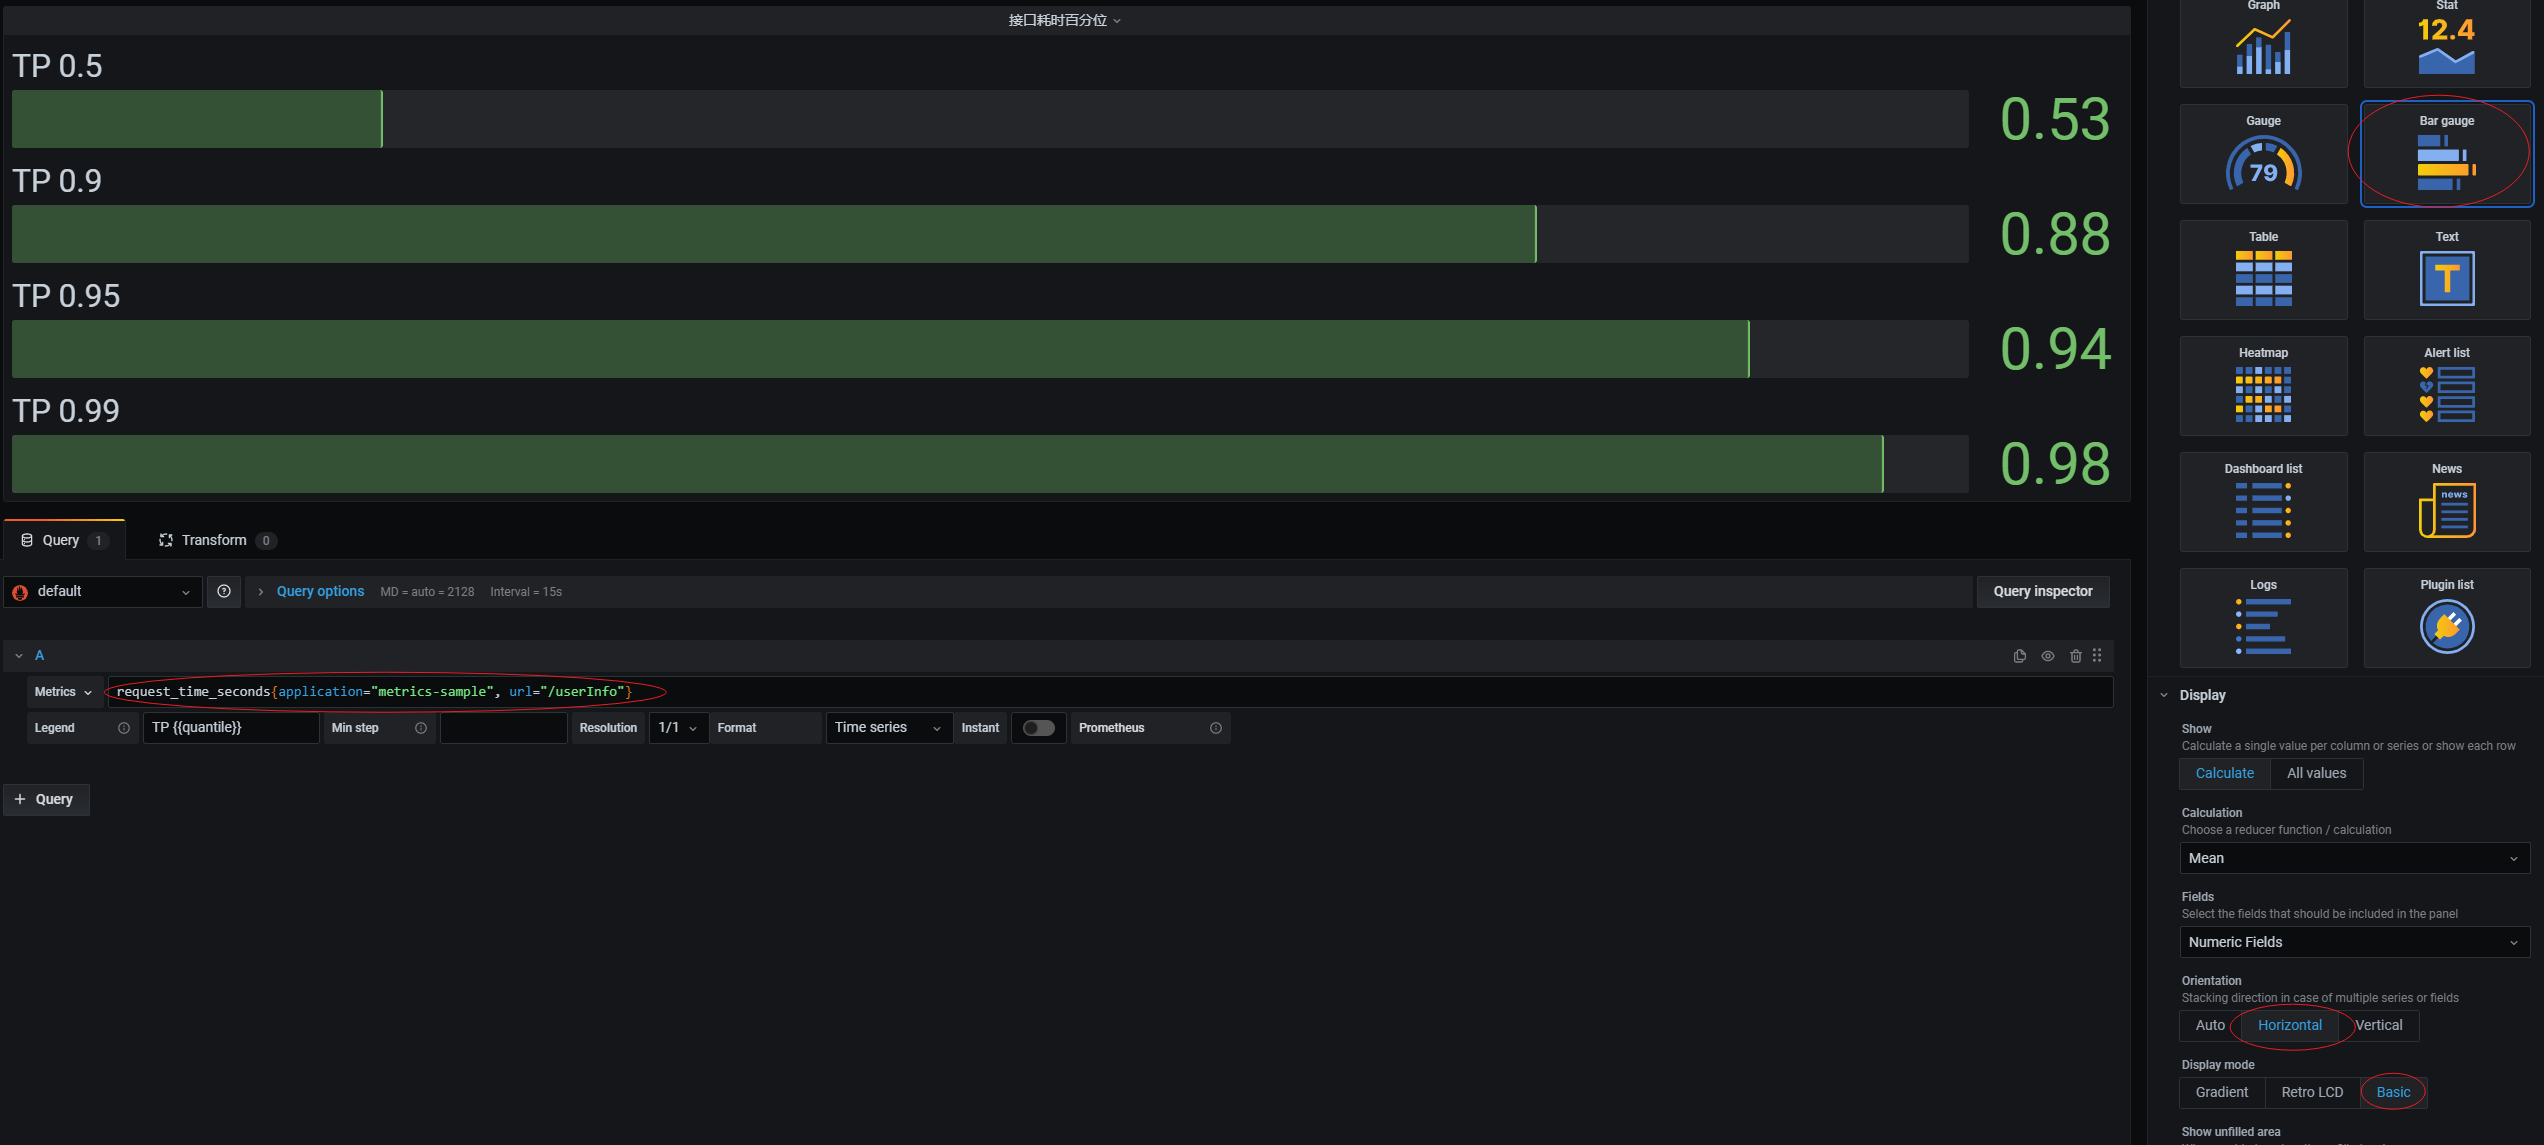
这张图表将展示接口的百分位耗时信息:
六、结尾
至此完成了在程序中进行 Metrics 埋点,并结合 Prometheus 和 Grafana,在大盘中可视化展示出来。Grafana 的可配置项很多,还需要大家自己去尝试和摸索。
 wechat
- alipay